Your dashboards should tie to revenue. Do they?
Most agencies hand you a PDF with charts. We give you a dashboard that shows which campaigns drive pipeline, which content converts, and which channels produce revenue.
Revenue-Connected Measurement
There’s a difference between reporting and measurement, and it matters enormously. Reports tell you what happened. Traffic was up 15%. Emails got 28% open rate. Ads got clicked 400 times. Those are facts. But facts without context are useless. Measurement tells you what to do next. It connects marketing activity to business outcomes. It answers the question every CEO cares about: "What marketing should we do more of, and what should we cut?"
Most marketing agencies deliver reports. They show you a PDF with 20 pages of charts: traffic by channel, conversion rates by campaign, email metrics by segment. It’s all technically accurate. But it doesn’t answer the question that matters: "Did this drive pipeline? Did it drive revenue? Should we double down or redirect?" Without revenue connection, you’re managing vanity metrics.
Grey Matter builds measurement systems, not reporting systems. We connect every marketing touch to pipeline and revenue. We track which campaigns generated leads that actually turned into qualified opportunities. We measure which content pieces influenced deals that closed. We show you cost per qualified lead by channel, cost per pipeline opportunity, and projected revenue impact per campaign. We identify which channels are efficient and which are wasteful. We show you the full customer journey, not just first-touch or last-touch, but the entire sequence of touches that led to a deal closing.
The result: you know exactly where to invest next. If webinars are generating $8 per pipeline dollar spent and LinkedIn is generating $4 per pipeline dollar, you scale webinars and recalibrate LinkedIn. Measurement drives strategy.
What We Measure
Pipeline Attribution
Which channels, campaigns, and content pieces actually generate qualified pipeline opportunities? We don’t just count first-touch conversions. We map the full buyer journey from the first awareness touch all the way to the qualified opportunity created in your CRM. We show you multi-touch attribution and channel influence. We identify which content pieces show up most often in opportunities and track which campaigns have the highest lift in pipeline generated.
Revenue Contribution
Which marketing touches actually influenced deals that closed and revenue that was booked? We track closed-won deals and work backwards to identify which marketing touches influenced them. We calculate the marketing influence on closed revenue — what percentage of your closed revenue came from marketing-influenced opportunities. That is the metric that connects marketing directly to business results.
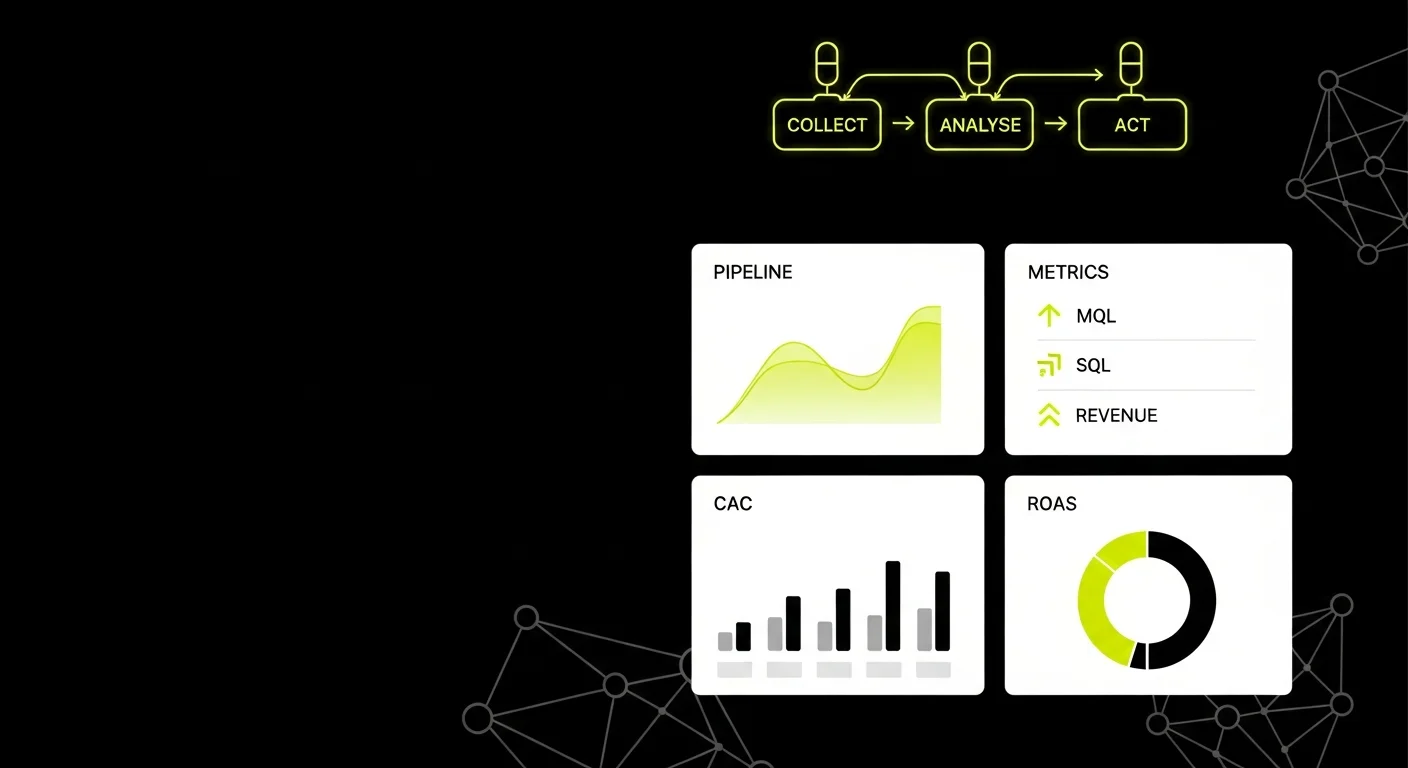
Efficiency Metrics
How efficiently is your marketing working? We calculate CAC by channel and campaign. We calculate ROAS — for every dollar spent on paid media, how much revenue came back. We calculate cost per qualified lead — what it costs to generate a lead that is actually worth sales' time. We track these metrics by channel, by campaign, and over time to reveal which approaches are efficient and which are wasteful.
Competitive Intelligence
How are you positioned relative to competitors? We track your share of voice — how often your brand appears in search results, in content, and in industry conversations. We track organic visibility trends, monitor competitor campaign activity, and identify market positioning gaps. This intelligence informs where you have competitive advantages and where you are exposed.
Our Reporting Stack
We build custom measurement systems using best-of-breed tools. The tool stack depends on your specific setup, but here’s what a typical integration looks like:
The magic isn’t in the individual tools. It’s in how they talk to each other. We create data pipelines that flow information from your marketing platforms to a central data warehouse, then into dashboards that non-technical stakeholders can actually understand. We automate data pulls and dashboard updates so you’re always looking at fresh data. We build custom calculated fields that connect marketing metrics to pipeline and revenue. We create attribution models that work for your specific sales cycle.
You own all your data. There’s no proprietary Grey Matter system that locks you in. If you decide to work with another agency, all your data and dashboards come with you. Transparency and ownership matter.
Frequently Asked Questions
Ready to fix your measurement? Let’s talk.
Get a free analytics audit and see where your measurement gaps are.